Analysis of Operating Decisions
2024-09-01
Topics
- Income measurement
- Nonrecurring items
- Deferred charges
- Earnings per share
1. Income measurement
1.1 Basics concepts behind accounting income
Two main concepts behind income measurement:
- Economic income measures the net change in shareholders’ wealth during a period. Theoretically, it is equal to a period’s cash flows plus the change in the present value of expected future cash flows.
- Recurrent income is an estimate of the stable average income that a business is expected to earn over its lifetime, given the current state of its business.
- Also called sustainable income or permanent income.
- The opposite is called Transitory income.
Accounting income is based on accrual accounting and is determined by the revenue recognition and matching costs principles.
- Accounting income purports to measure neither economic income nor recurring income.
- Also called reported income or book income.
- Accounting income has measurement errors (managerial incentives).
Recurrent income: each euro of this income is equal to \(1/r\) euros of today’s company value, where \(r\) is the cost of capital.
- If Recurrent income is $100 and the cost of capital is 10%, then company value is $1,000 (=$100/0.1).
Transitory income: each euro of this income is equal to one euro of company value.
- If the company receives $10 from a lawsuit, then company value is $1.000+$10= $1,010.
- Important: assuming that company value is $110/0.1 = $1,100 is a big mistake because the $10 is a one-time event, cannot be part of the perpetuity of future cash flows.
Assume that market price is $1.020: who will be interested to buy? to sell?
Our focus now is to try to identify/estimate the recurrent income component of the accounting income.
Common misconceptions: a majority of operating income components tend to be recurring, but not always:
- Loss of inventory from a fire ➡️ nonrecurring operating loss.
- Interest earned ➡️ recurring and nonoperating income.
This means we need to dig deeper into the financial statements to identify the recurring income components.
1.2 Measuring accounting income
Revenues
Our key questions:
- Where is the net sales growth coming from? Segments/products.
- What is the explanation for the sales growth?
- Remember the last topic: receivable manipulation to manage earnings.
- Can the growth be sustained? For how long?
Fortunately, IFRS 8 and ASC Topic 280 (“Operating segments” and “Reporting segment,” respectively) require companies to report information about their operating segments, sales, margins, and a reconciliation of segment information to the consolidated financial statements.
Cost of sales and other operating expenses:
Cost of sales:
- Check “inventory accounting” section in the previous topic: cost of good sold (COGS).
- It also may include labor and other direct costs associated with providing a service.
R&D:
- Check “long-term investment” in the previous topic: intangible assets.
Selling, general and administrative expenses (SG&A):
- Costs related to the promotion and sales (advertising, sales commissions, etc.), general costs (rent, utilities, etc.), and administrative costs (executive salaries, legal fees, cost of compliance with regulations).
Example [20 min]
Apple: Consolidated Statements of Operations, and Notes 2, 13.
Mercedez: Consolidated Statement of Income, and Notes 5, 6, 34.
- How much were the net sales? Which product/service/segment represented the largest share of sales? Which grew the most?
- Operating Expenses/ Functional costs: how were they distributed? Which one was growing the most? Any clear explanation?
- Product/Service/segment: which one was more profitable?
- To what extent are operating profits stable?
Net income
- Net income is the sum of income from operations and other sources of income/expenses items.
- Net income is the most widely reported measure of income.
- But it excludes unrealized (holding) gains and losses
- e.g.: unrealized gains or losses on available-for-sale securities and foreign currency translation adjustments.
Comprehensive income
- Reflects nearly all changes in the value of equity.
- Excluding changes driven by dividends and share issuance.
- Comprehensive income is the bottom-line measure of income: the best proxy for economic income.
Components of comprehensive income:
- Net income
- Other comprehensive income:
- Unrealized gains or losses that result from changes in the fair value of available-for-sale securities.
- Unrealized gains or losses arising from the effective portion of cash flow hedges (derivatives);
- Foreign currency translation gains and losses.
- Changes in the funded status of post-retirement benefits not included in net income.
- (IFRS) revaluations of operating assets to their fair values.
1.3 Analysis of accounting income:
So, what is the correct way to capture recurrent income?
A huge debate about what lines should be included (excluded) when measuring income:
Firm valuation/recurring income? Some analysts prefer to use income from operations because of its (pseudo) recurring nature. Others prefer net income plus some adjustments.
Measure of net change in equity (or economic income)? Comprehensive income.
Important: all these measures are subject to accounting distortions and errors.
2. Nonrecurring items
2.1 Discontinued operations
Companies sometimes dispose of entire divisions or product lines.
When these dispositions pertain to separately identifiable business components, they are called discontinued operations.
Discontinued operations are separately reported on the income statement and the balance sheet.
Accounting for discontinued operations:
The standard is set in US GAAP (ASC 225) and IFRS 5.
Req: the operations and cash-flows of the divested business component must be distinguished from those of the (continuing) operations.
Restating past 2 years income statements excluding the discontinued operations.
In the current year income statement the discontinued operations are reported separately, net of tax, below income from continuing operations.
In the current year Balance sheet: assets (liab.) that relate to discontinued operations are segregated and shown separately as assets (liab.) held for disposal.
Analysis of discontinued operations:
- Discontinued operations are not expected to recur, so they are irrelevant for determining the permanent income,
- The adjustment is straightforward.
- For the current and past two years because companies must restate their income statements, reporting the income of discontinued operations separately.
- Details on these assets and liabilities held for disposal are typically provided as footnotes.
2.2 Accounting changes
Managers may change accounting methods or estimates for a variety of reasons, including:
- Adopt new accounting standards.
- To better reflect changes in business conditions.
- To manipulate earnings.
Of course, accounting regulations discourage managers from applying unjustified changes in accounting methods or estimates.
Types of accounting changes
- Change in accounting principles
e.g., change from Average to FIFO in inventory method, or from straight-line to accelerated depreciation.
Importantly, the application of the new principle should be reported retrospectively.
This means that current and prior periods information in the income statement and balance sheet should reflect the new principle.
- Change in accounting estimate
e.g., change in the estimated useful life of a depreciable asset, loss allowances, warranty obligations, etc.
If managers update their beliefs about the future, they should update their estimates: economic crisis and allowance of doubtful accounts.
The change should be reflected in the financial statements prospectively (so no restatement of prior periods is required).
Analysis of accounting changes:
In both cases (accounting principle and estimate), the analyst must consider that the accounting changes don’t yield cash-flow consequences, either present or future.
But this does not mean that the changes are irrelevant or mere cosmetics: they can reflect a new economic reality (or an attempt to improve reported earnings).
Furthermore, the changes can affect the comparability of financial statements across periods, even within the same company.
2.3 Extraordinary and Unusual Items
Now called “Unusual or Infrequently Occurring Items
Restructuring charges.
Major Casualties: Rare natural disasters (write-offs).
Expropriation or new regulation (e.g., sudden ban on a product line)
Major legal settlements.
By large, they are the most common and important class of nonrecurring items.
- 1980s: just 1% of companies reported special or extraordinary items.
- by 2015: nearly 50% of the US companies report them.
- 2% of total revenues.
Before 2015, extraordinary items were reported at the bottom of the Income Statement.
Now, if the event is material, it should be reported as a separate line item on the Income Statement (normally as operating expenses), or disclose it in the notes to the financial statements (ASU 2015-01 and IAS 1).
These items are a cumbersome topic among analyst.
First, the economic implications of special items, such as restructuring charges, are complex.
Second, many special items are discretionary and, hence, can be used to manipulate earnings.
Example: earnings management with extraordinary items.
Consider a firm with a cost of capital of 10%.
Real scenario: a company earns $2 per share in perpetuity. Then, the company’s value is $20 (=$2/0.1).
Manipulated scenario: the company overstates earnings by $1 per share during four consecutive periods and then reverses them with a single charge in the final year as follows
| $ per share | 2018 | 2019 | 2020 | 2021 |
|---|---|---|---|---|
| Recurring earnings | $3 | $3 | $3 | $3 |
| Special items | 0 | 0 | 0 | -4 |
| Reported net income | $3 | $3 | $3 | -$1 |
In this reporting pattern: permanent income is $3 and a transitory “special item” of -$4 in just one year.
A naive analyst would consider the -$4 as a transitory shock and value the stock at $26 (=$3/0.1 - $4).
An even less prepared analyst would remove the special item from the income statement and value the stock at $30 (=$3/0.1).
Example: Ford 2019 and special items reporting.
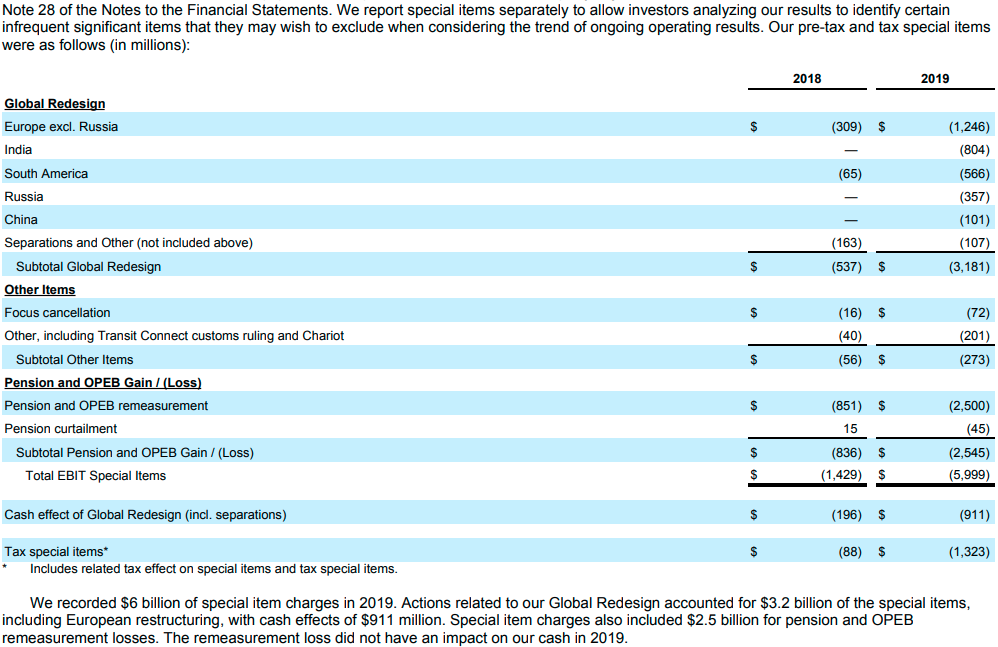
Exercise in MS Excel [20 min]
3. Deferred charges
Deferred charges are costs incurred that are deferred because they are expected to benefit future periods.
The motivation for deferral of costs is to match these costs with their expected benefit generation.
This motivation underlies the capitalization of all long-term assets and their depreciation, as discussed in the previous topic.
3.1 R&D costs
R&D expenses are the cost of the resources used to explore, discover, and develop or improve new products and processes.
R&D activities exclude routine or periodic alterations in ongoing operations, market research, and testing activities.
R&D costs include:
- Materials, equipment, and facilities acquired or constructed for a specific R&D project,
- Materials consumed in R&D activities; and depreciation of equipment or facilities, and amortization of intangible assets used in R&D activities.
- Salaries (and other related labor costs) of personnel engaged in R&D activities.
Accounting for R&D costs:
The high uncertainty of the benefits of R&D activities makes it difficult to match costs with benefits.
- Would this research line be successful? When will the benefits be realized? How long will the benefits last?
So, even though R&D costs are (intangible) capital investments by nature, they are mostly expensed as incurred.
IFRS (IAS 38) allows capitalization of R&D costs in the later stages (“development”) if certain conditions are met:
- the technical feasibility of completing the intangible asset so that it will be available for use or sale.
- the intention to complete the intangible asset and use or sell it.
- the ability to use or sell the intangible asset.
So, what can we look for in the financial statements to identify the R&D activities of a company besides the periodic R&D expenses?
Voluntary disclosure of:
- Types of research projects their current status and plan ahead.
- How close a project is from the technical feasibility and commercial viability.
- Success/failure experience with R&D activities to date.
3.2 Income taxes
Income tax expense (or provision) is a significant expense for most companies.
The rules for determining the amount of income tax are based on Tax Laws.
- country-specific
- complex and subject to change
- different tax rates for different types of income
- exemptions or deductions
- losses are carried forward and offset with income arising in future periods
In general, tax rules differ substantially from accounting rules used to measure accounting income.
Therefore, taxable income is not equal to accounting income.
Differences:
temporary differences: timing differences about when revenues and expenses are recognized for tax and accounting purposes. The difference is expected to be reversed in the future.
- e.g., depreciation expense is recognized earlier for tax purposes than for accounting purposes.
- deferred tax adjustments are used to reconcile taxable income and accounting income.
Differences:
permanent differences: differences that are not expected to reverse in the future
- e.g., interest income on municipal bonds is not taxable, but it is included in accounting income.
How to account for temporary differences?
Two key concepts: DTA and DLT
Tax Expense = What Shareholders see (based on GAAP/IFRS rules).
Tax Payable = What the Tax Authority sees (based on Tax Code rules).
If the company recognizes at year t a Tax Expense of $100, but only pays the the tax authority $80 (Tax Payable), it will owe the remaining $20 for later. That is a Deferred Tax Liability (DTL): recognition of a new obligation.
If the company recognizes at year t a Tax Expense of $80, but the tax law mandates to pay $100 the same year, then the company have “prepaid” $20. That is Deferret Tax Asset (DTA).
Example: deferred tax liability
A company purchases an asset for $10,000. This asset is depreciated using the Straight-Line method for financial reporting purposes over 5 years, resulting in an annual depreciation of $2,000.
Tax law enables the company to use an accelerated depreciation method, deducting $4,500 in the first year, $3,500 in the second year, $1,000 in the third year, and $500 in the fourth and fifth years.
Given a tax rate of 30%, let’s calculate the deferred tax liability arising from the difference in depreciation methods:
| Year | Accounting Dep | Tax Dep | Temp. Diff | DTL/DTA | Cumulative DTL/DTA |
|---|---|---|---|---|---|
| 1 | $2,000 | $4,500 | $2,500 | $750 DTL | $750 DTL |
| 2 | $2,000 | $3,500 | $1,500 | $450 DTL | $1,200 DTL |
| 3 | $2,000 | $1,000 | ($1,000) | $300 DTA | $900 DTL |
| 4 | $2,000 | $500 | ($1,500) | $450 DTA | $450 DTL |
| 5 | $2,000 | $500 | ($1,500) | $450 DTA | $0 |
Each year, the Net income= Pretax Income - Tax Expense, and Tax Expense = Tax Payable + DTL( or - DTA).
In Year 1: less accounting depreciation means more accounting profits and more “calculated” tax expense. But as the tax law induces faster depreciation, taxable income in tax files is tiny (let’s say zero), meaning almost no tax payable. The difference between tax expenses and the actual check to the Tax Authority is recognized as an obligation/liability, because it will revert later on.
Analyzing deferred tax adjustments
Are they truly assets and liabilities?
All that a DLT or DTA suggests is that the actual tax payments will be proportionally higher (or lower) in the future because tax payments were proportionally lower (or higher) in the past.
E.g., the DTL in the previous example is not a liability because the company does not have a contractual obligation with anyone. Still, it is a liability in the sense the company will have to pay more taxes in the future relative to the GAAP income.
- In this sense, DTA and DTL do provide information about future cash flows to the extent that the temporary differences are reversed
- But they do not always reverse! company growths, tax reforms, accounting reforms, inflation, future losses, etc.
Many analysts exclude DTA and DTL from the balance sheet when conducting ratio analysis.
In some industries, it is even the standard procedure: Moody’s recommends that deferred tax assets or liabilities be excluded when determining solvency or liquidity ratios such as debt-to-equity ratio or current ratio.
Accounting for deferred tax adjustments
This topic can take a whole course, so we will just focus on two core points. An interested reader can check US GAAP (ASC 740) and IFRS (IAS 12).
Computation of tax expense: Income tax expense (or provision) is not computed directly. Rather, it is computed as the difference between the change in DTA and DTL, and the tax payable to taxing authorities.
Level computation: Deferred taxes are determined separately for each tax-paying component (an individual entity or group of entities consolidated for tax purposes) in each tax jurisdiction.
Example Apple and Mercedez Benz
Check Note on “income tax”.
4. Earnings per share
Earnings per share (EPS) data are widely used in evaluating a company’s operating performance and profitability.
Analysts use this core metric to value a company and for the business press when reporting earnings announcements.
Given the importance of EPS, it is unsurprising that companies are motivated to manage earnings to meet or beat analysts’ EPS forecasts.
So, it is important to understand how EPS is calculated and how it can be manipulated.
The computation and reporting requirements for earnings per share under US GAAP (ASC 260) and IFRS (IAS 33) are consistent.
Before understanding the computation of EPS, we need to understand the concept of capital structure and dilution.
Imagine a company with 100 common shares outstanding. Each share is worth $10, so the company’s equity is worth $1,000.
- 1 share= 1% of the company.
- the company issued 60 new shares, so common shares outstanding = 160 shares.
- 1 share = 0.625% of the company. Ownership dilution!
Current investors are alert for newly issued shares or convertible securities because they dilute their ownership investment.
| Simple Capital Structure | Complex Capital Structure |
|---|---|
| Common shares | |
| Preferred shares | |
| + Convertible debt | |
| + Convertible preferred shares | |
| + Warrants |
4.1 Basic EPS
It is computed considering only simple capital structures with only common stock and neither dilutive nor convertible securities. \[ \text{Basic earnings per share}= \frac{\text{Net income - Preferred dividends}}{\text{Weighted-average number of common shares outstanding}} \]
where \(\text{weighted-average number of common shares}\) is the sum of shares outstanding each day, divided by the number of days in the period.
How to calculate the Weighted-average number of common shares?
Example:
| Commom Shares | Shares oustanding | Time weight | Weighted Av. C. Shares | |
|---|---|---|---|---|
| 1st Jan | 2,000,000 | 2/12 | 333,333 | |
| 1st Mar | 100,000 | 2,100,000 | 4/12 | 700,000 |
| 1st Jul | 150,000 | 2,250,000 | 5/12 | 937,500 |
| 1st Dec | -200,000 | 2,050,000 | 1/12 | 170,833 |
| Total | 12 m | 2,141,667 |
Apple 2020. Check in the MD&A section (Item 7) the “Fiscal 2020 Highlights” and “Capital Return Program.” about check repurchases during the year.
Changes in the number of shares outstanding
- Stock dividends: the company pays a dividend in the form of additional shares of stock (instead of a cash payment).
- e.g., 50% stock dividend: 1 new share for every 2 shares owned.
- the initial number of shares outstanding is increased by 50%.
- Stock split: the company increases the number of shares outstanding by a specified ratio.
- e.g., 3-for-2 stock split: for every 2 shares owned, the investor receives 3 additional shares.
- Apple: four-for-one stock split (“Fiscal 2020 Highlights”).
- Importantly, shareholders’ % of ownership does not change with stock dividends or splits. No dilution!
4.2 Diluted EPS
This applies to cases where the company has potentially dilutive securities, such as convertible bonds, convertible preferred stock, stock options, and warrants.
- Convertible preferred stock: preferred stock that can be converted into a fixed number of common stock at the option of the holder.
- Convertible bond: debt securities that can be converted into a fixed number of common stock at the option of the holder.
- Options: the right to purchase a fixed number of shares of common stock at a specified price (exercise price) for a specified period.
- Warrants are similar to options but issued by the company.
If exercised -> increase number of common shares outstanding dilution!
Above 25% of publicly-traded companies in the U.S. have potentially dilutive securities.
Diluted EPS is computed assuming that all convertible securities are converted and options exercised at the earliest possible opportunity (full dilution)
\[ \text{Diluted EPS}= \frac{ \text{Net income - Pref div}+\text{Conv pref div}+\text{Conv debt int}*(1-t)} {\text{Weighted-av num of common shares outstanding (incl dil securities)}} \]
Example 1: Convertible preferred share
At the end of the year, Maule Limited had a net income = $1,450,000. Common Shares = 400,000 and preferred convertible shares = 25,000. The preferred dividend is $11 per share. Each convertible preferred share can be converted into 6 common shares. The tax rate is 25%.
- Net income - Pref. dividend = $1,450,000 - $11x25,000 = $1,175,000
- if-converted: $1,450,000
- Weighted-average # common shares outstanding = 400,000
- if-converted: # shares = 400,000 + 25,000x6 = 650,000
- Basic EPS = $1,175,000/400,000 = $2.94
- Diluted EPS = $1,450,000/550,000 = $2.64 < Basic EPS. Dilution!
Example 2: Convertible bond
Same company, same net income, but instead of convertible preferred shares, the company has convertible bonds: 5% convertible bonds= $60.000 convertible into #10.000 common shares.
- Net income - Pref. dividends = $1,450,000 - 0 = $1,450,000
- if-converted: no interest expense, meaning more net income: 5% x $60,000 x (1-0.25) = $2,250
- Weighted-average # common shares outstanding = 400,000
- if-converted: # shares = 400,000 + 10.000 = 410,000
- Basic EPS = $1,450,000/400,000 = $3.63
- Diluted EPS = ($1,450,000 + $2,250)/(410,000) = $3.54 < Basic EPS. Dilution!
Example 3: Stock options
Same company, same net income, same taxes. Company has # 30,000 stock options to buy common shares at exercise price = $30. The current market price of the company’s common stock is $50.
- Net income - Pref. dividends = $1,450,000 - 0 = $1,450,000
- if-converted: no change.
- Weighted-average # common shares outstanding = 400,000
- if-converted: # 30.000 newly issued shares. Proceeds from issuance = $30 x 30,000 = $900,000. With this inflow of funds, the company can buy back 18,000 shares. So, # shares = 400,000 + 30,000 - 18,000 = 412,000
- Basic EPS = $1,450,000/400,000 = $3.63
- Diluted EPS = ($1,450,000)/(412,000)= $3.52 < Basic EPS. Dilution!
Try at home:
- Current market price= exercise price= $ 30
- EPS=DEPS=3.625.
- Current market price= $ 20
- EPS=3.625, DEPS=3.767. Anti-dilution!
Example 4: All together
Common stock: 1,000,000 shares outstanding for the entire year. Preferred stock: 500,000 shares outstanding for the entire year.
Convertible bonds: $5,000,000 6% bonds, sold at par, convertible into 200,000 shares of common stock.
Employee stock options: options to purchase 100,000 shares at $30 have been outstanding for the entire year.
The market price of the company’s common stock is $40.
Net income: $3,000,000; Preferred dividends: $50,000; Marginal tax rate: 35%.
\[\text{Basic EPS} = \frac{3,000,000 - 50,000}{1,000,000} = \$2.95\]
\[ \text{Diluted EPS} = \frac{3,000,000 - 50,000 +[(5,000,000 \times 6\%)(1 - 0.35)]}{1,000,000 + 200,000 + 25,000}= $2.57\]
Example Apple and Mercedes-Benz
- Search “EPS” in their Income Statement.
- Compare with the forecasts of the analyst in Yahoo Finance.
- Are analyst forecasting an increase in EPS?
- What is the effect of the stock buyback program “Capital Return Program” in the EPS?
- Show in Seeking Alpha the “Earnings Estimates” and “Earnings Revisions” sections.
Questions?
Check my website for an updated version of this presentation:
https://www.marceloortizm.com/
Based on:
- Subramanyam, K. R. (2014). Financial statement analysis. McGraw-Hill Education. Chapter 6.
- Fridson, M. S., & Alvarez, F. (2022). Financial statement analysis: a practitioner’s guide. John Wiley & Sons. Chapters 6-8.
- Steven M. Bragg (2022). IFRS Guidebook. Accounting Tools. Chapters 20-23.
- IFRS 15 Revenue from Contracts with Customers.
- IFRS 8 Operating Segments.
- IFRS 2 Share-based Payment.
- IFRS 5 Non-current Assets Held for Sale and Discontinued Operations.
- IAS 12 Income Taxes.
- IAS 38 Intangible Assets.